September 2021 - Claims Plots is a powerful suite of data submission, integration, and warehousing services for APCD systems. Claims Plots is a cloud based platform-as-a-service (PaaS) solution, scalable to include data for as many commercial and public payers as required and to support very frequent data loading without increasing the services costs. The platform is designed for simpler integration with public data initiatives such as Health Information Exchanges (HIE), public health or state Medicaid data lakes, offering automated software modules for data submission, data validation, data processing, most common value adds, and analytic reports.
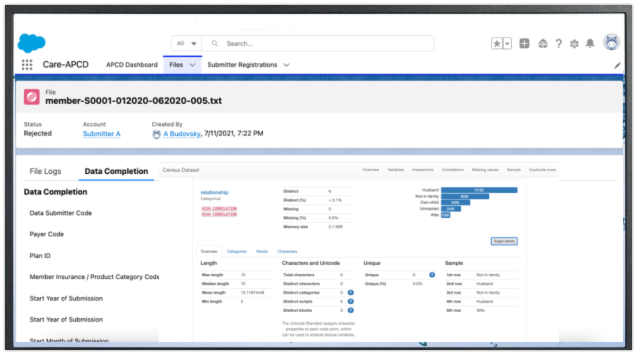
Claims Plots's data submission portal allows APCD administrators and data submitters to track data submissions more intuitively through a Salesforce based user interface backed by faster processing, efficient data-quality review, variance management, notifications and applications.
Claims Plots data architecture is designed as a "lake-house" that can standardize, catalogue, and link claims and non-claims data sources, ingest alternative payment (APM) data, process value adds and accommodate complex use cases. The solution can integrate seamlessly with industry‘s most advanced identity management software solutions, delivering a Master Patient Index and Provider Registries that can work accurately for both administrative and clinical data.
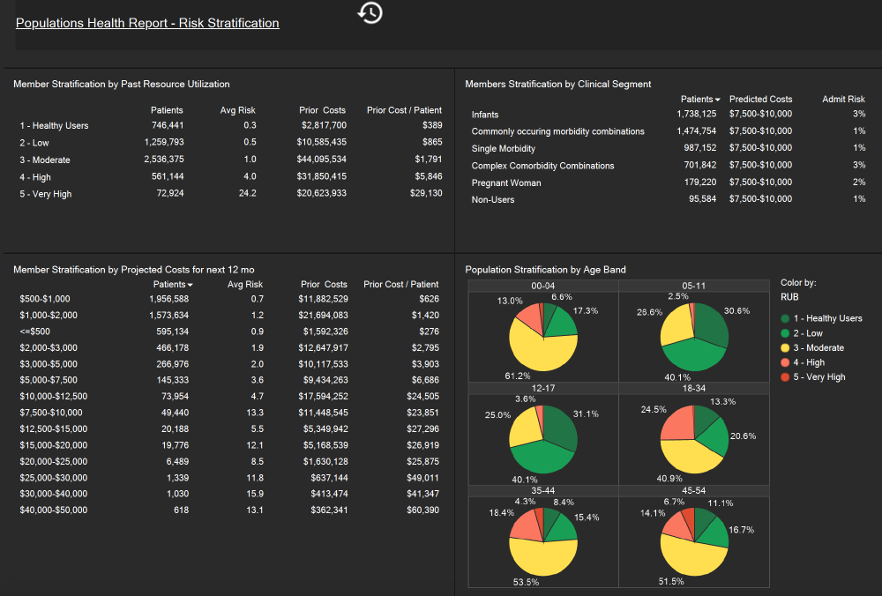
It also includes a series of analytic reports for health services expenditure and utilization, quality of care and performance evaluations safely designed for state evaluation purposes. Analysts can select from hundreds of pre-calculated metrics for medical and drug costs, services utilization, quality of care and prevention, provider performance assessment, enabling efficient design of population health management and value based care reports.
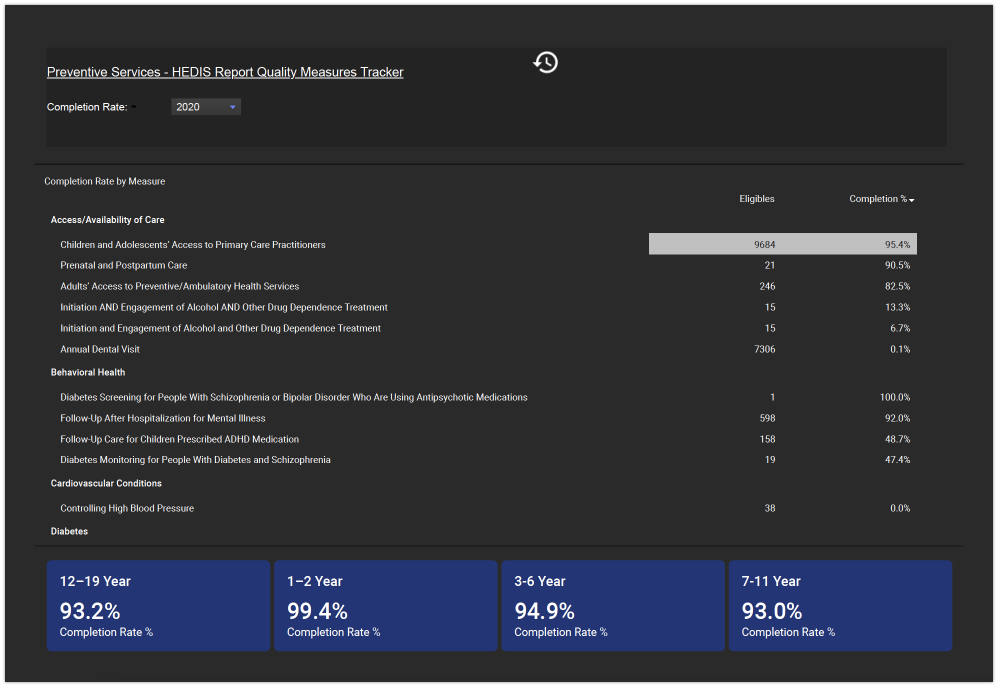
The analytic data models are organized as data marts that are storing pre-joined, pre-aggregated and pre-calculated reporting measures at specific levels of aggregation. The “person level” data mart contains hundreds of measures, including cost and utilization metrics, chronic condition flags, select services utilization flags, treatment adherence metrics, risk scores, predictive costs and inpatient service use, attributed provider, etc. In addition, HEDIS quality measures and preventive services (claims specific) are calculated and monitored per member, per data release period. The Provider data marts (facility and practice) allow users to report trends in performance using episodes of care data, and quality of care metrics that are rolled up at attributed populations levels.
Lastly the platform includes secured high performance computing workspaces enabling self-service analysis capabilities, offering technology from business intelligence, statistical packages and GIS tools to advanced machine learning data analysis options.
About Careplots. Careplots’s mission is to empower healthcare transformation at the state and regional community levels through data innovation by providing insightful health data solutions. Claims Plots will allow states to accelerate implementations and to expedite delivery of actionable information for new APCDs as well as for the established ones. For more information, please visit the Careplots Website.